
By Sabahat Ali – Link building expert since 2009 – 668+ clients served
KEY STATISTICS
- Infographics earn 178% more backlinks than plain text pages [Spiralytics, 2025]
- Infographics generate 2x more links than standard blog posts [Spiralytics]
- 48% outreach success rate when personalizing infographic pitches [Outreach Monks]
- Infographics increase web traffic by up to 12% [HubSpot, 2024]
- 80% of webmasters who respond to outreach demand payment [Our data, 100K+ emails]
Looking for a high-impact link-building strategy that actually converts?
It is time to leverage infographic links.
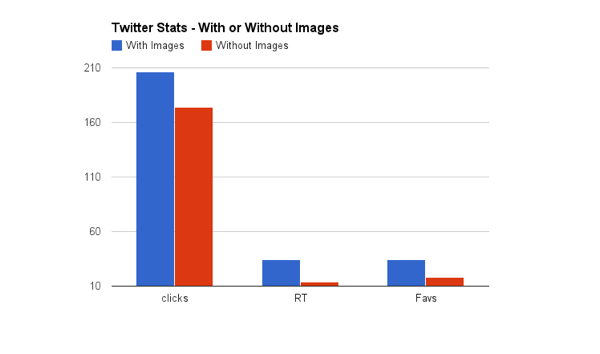
Visual content is the most digestible form of information online. Research shows that infographics are 30x more likely to be read than text-heavy articles. More importantly, they are shared 3x more often than any other content type, making them a powerhouse for modern SEO.
At SERPReach, we use infographic links as a cornerstone for boosting search rankings. This guide provides a proven framework to replicate this success for your brand.
Quick Preview:
- The mechanics of embedding links in visuals.
- What defines a high-quality infographic link?
- A step-by-step framework to create infographic links.
- Quantifiable benefits and ROI.
Can You Put Links in Infographics?
Featured Snippet: Infographic links are backlinks earned when external websites embed your visual data and credit the source with a clickable URL. To create infographic links effectively, marketers produce high-value visualizations that solve specific problems, encouraging authoritative sites to reference the content and provide a powerful, contextually relevant backlink.
Yes, you can and should. Embedding links within or alongside your infographics allows you to summarize complex data points while driving specific user actions, such as:
- Gathering user feedback or opinions.
- Accelerating email list growth via lead magnets.
- Improving internal navigation within long-form content.
To succeed, an infographic link must be embedded in an information-rich image—whether it’s a data set, a quote gallery, or a process map. The goal is to produce “link-worthy” assets that editors feel compelled to share.
Success in this niche requires aligning your visual format with audience intent. Common formats include:
- Statistical and Data Visualization
- Process and “How-to” Guides
- Geographic/Demographic Maps
- Timeline and Evolution Graphics
PRO TIP:
Design is only 50% of the battle. The real value of an infographic link-building strategy lies in your outreach and the authority of the sites that host your graphic.
How to Create Infographic links: A Step-by-Step Guide
EXECUTION GUIDE:
Follow these practical, research-backed steps to source concepts, design assets, and secure backlinks.
Find the Concept
Avoid guesswork. Successful infographics are built on “tested” topics that have already proven their virality.
- Visual.ly: Visit Visual.ly and filter by “Faved” to identify trending visuals in your niche.
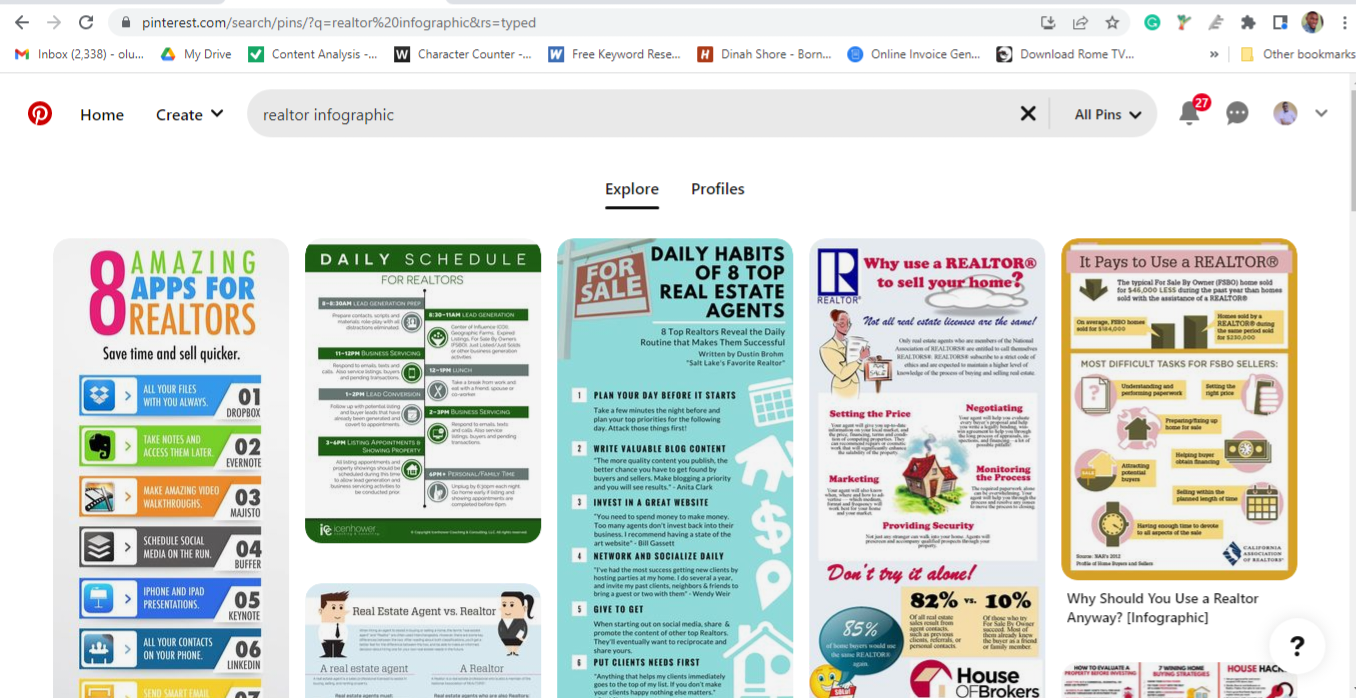
- Pinterest: Search for “[Your Industry] infographic” and prioritize designs with high pin counts.
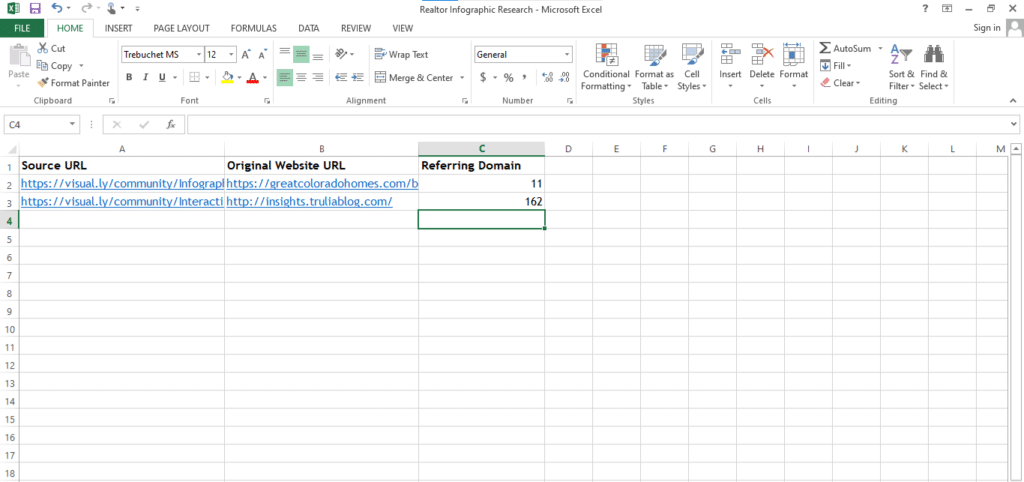
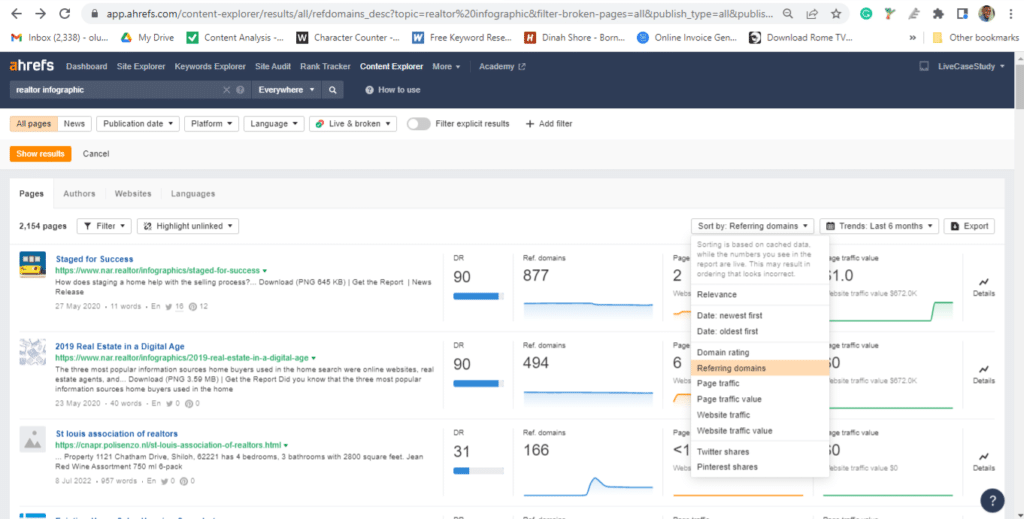
- Ahrefs Content Explorer: Search your keyword and sort by “Referring Domains” to find visuals that have already earned significant backlinks.
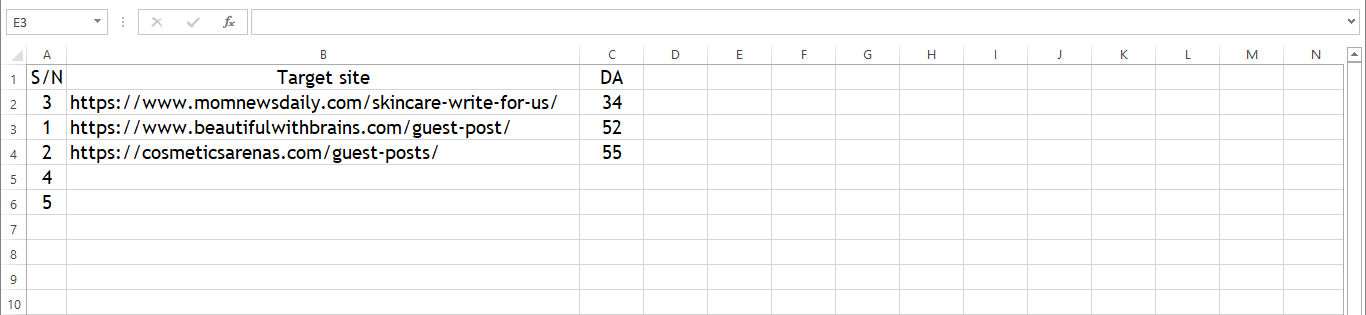
Select your top 5 concepts and document the source URLs in a tracking spreadsheet.
Refine The Statistics
Accuracy builds authority (E-E-A-T). Never use outdated data. Update existing statistics by searching for “[Keyword] + statistics + 2025” to ensure your asset is current and relevant.
Design the Infographic
You have three primary paths for production:
| Method | Best For | Cost Level |
|---|---|---|
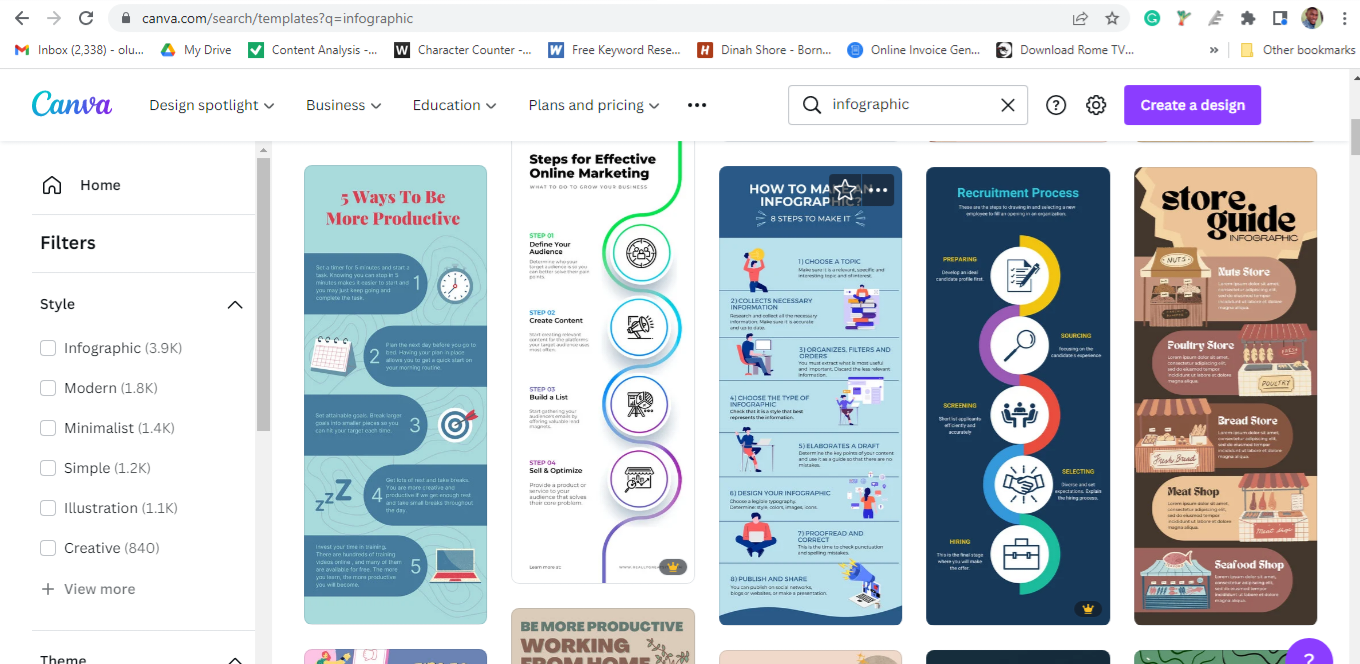
| Canva | Quick templates & DIY users | Free / Low |
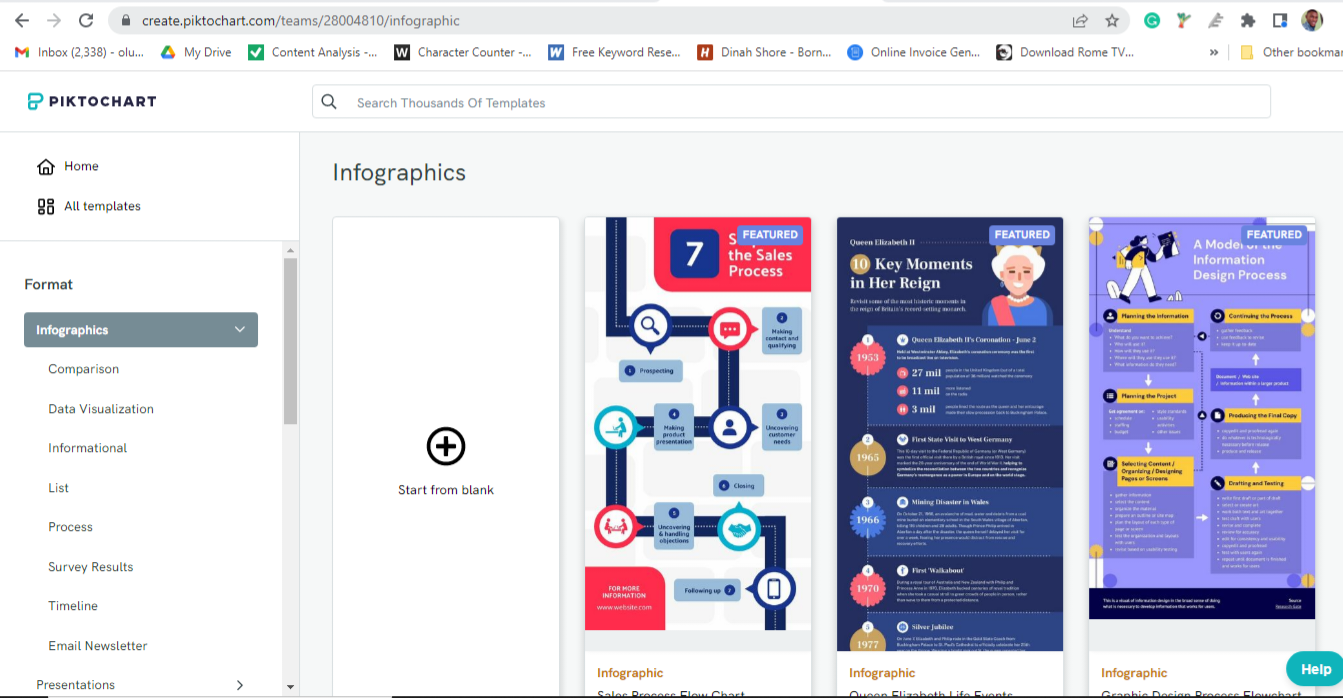
| Piktochart | Data-heavy, professional charts | Moderate |
| Freelance Designer | Unique, custom-branded assets | Varies |
Finalize the Infographic Title
Your title must be SEO-optimized and compelling. Examples: “The 2025 State of [Niche]” or “7 Vital Trends Impacting [Industry].” Keep it under 60 characters for maximum impact.
Optimize for Generative Engine Optimization (GEO)
AI search engines (Perplexity, ChatGPT, Gemini) rely on text and structured data to “see” your infographic. To create infographic links that AI will cite:
- Include a Text Summary: Place a 150-word breakdown of key takeaways next to the image.
- Implement Schema Markup: Use ImageObject and Dataset schema to help AI crawlers index the information.
- Embed Codes: Provide an HTML embed box with a link back to your site, ensuring proper attribution.
Outreach Strategy
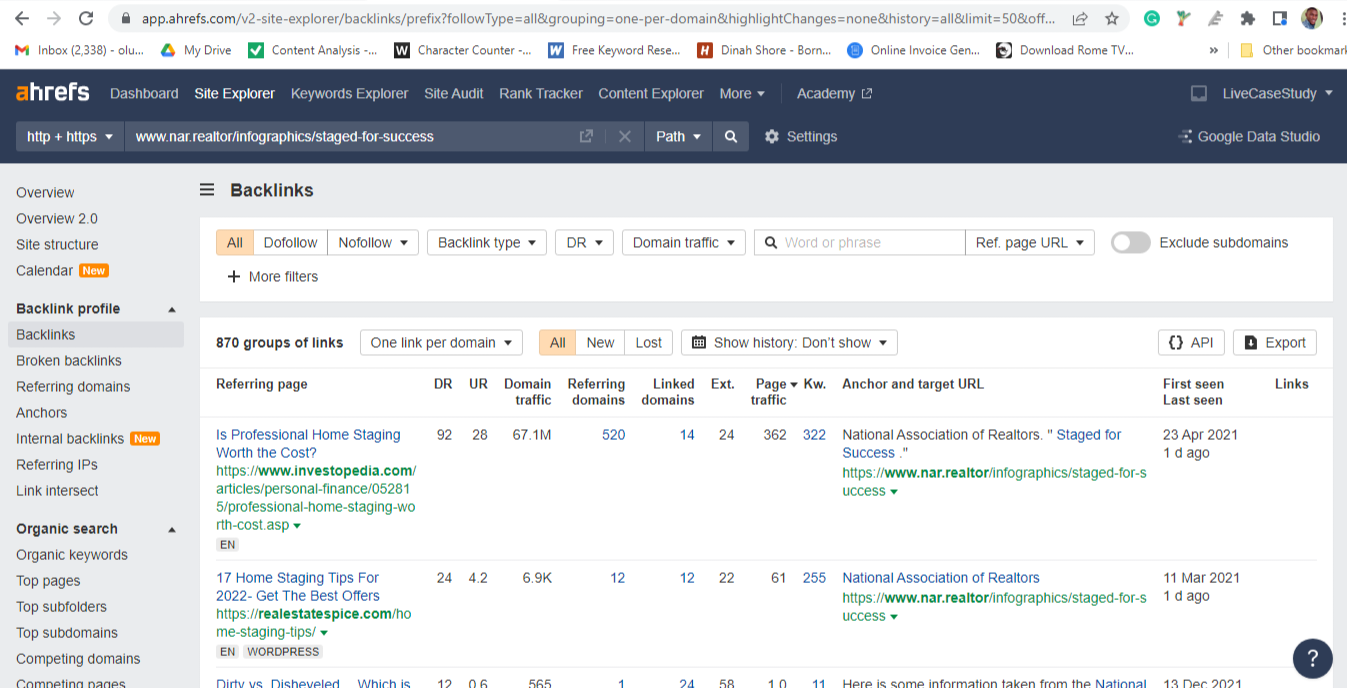
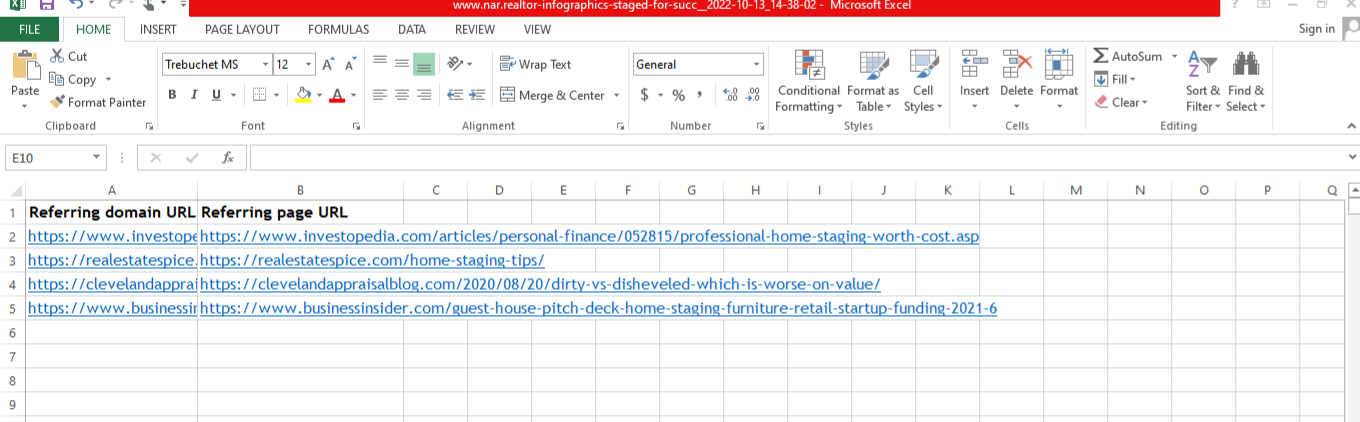
Identify sites that have linked to similar graphics using Ahrefs Site Explorer. Export these “referring page URLs” to build your target list.
Interactive Asset: Copy-Paste Outreach Script
Link-Building Outreach Template:
Subject: Visualizing [Topic] for [Their Website Name]
Hi [Name],
I was reading your article on [Topic] and noticed you referenced [Old Stat/Data]. I recently designed a custom infographic that visualizes the latest 2025 trends for [Topic], and I thought your readers would find it incredibly valuable.
You can view the high-res preview here: [Link to Imgur/Hosting].
If you’d like to feature it, feel free! All I ask is a simple attribution link back to our original study. Would you be interested in a custom introduction to go along with it?
Best,
[Your Name] [Your Company Signature]Are infographic links worth using?
Infographic link building is resource-intensive but offers unparalleled ROI. Humans process visuals 60,000x faster than text, which explains why infographics increase website traffic by an average of 12%.
Case Study: How KISSmetrics Scaled with Infographics
Between 2010 and 2012, KISSmetrics leveraged a dedicated infographic strategy to achieve massive growth:
- Investment: $28,200 for 47 infographics.
- Results: 2.5 million visitors and 41,000 backlinks from 3,700 unique domains.
- Virality: 41,000 tweets and 20,000+ likes.
- Cost Savings: This traffic would have cost $1,072,905.80 via paid advertising.
This demonstrates that infographic links are one of the most cost-effective ways to build long-term SEO authority.
Infographic Link Building: What the Data Shows
178% More Backlinks: Pages with infographics earn 178% more backlinks than plain-text pages, and infographics generate 2x more links on average compared to standard blog posts [Spiralytics, 2025].
Case Study — 150+ Backlinks from DA 70+ Sites: One campaign designed a downloadable infographic summarizing key statistics and promoted it through LinkedIn and outreach. The result: 150+ backlinks, many from domains with DA over 70 [Konker, 2025].
Sales Email Infographic — Published on SmallBizTrends, SalesHacker: Spencer Smith created an infographic about how to write effective sales emails. It was picked up by major publications including Small Biz Trends and Top Dog Social Media, earning high-authority backlinks through organic sharing [Ranko Media, 2025].
48% Outreach Success Rate: Infographic outreach emails that include a personalized note explaining how the graphic ties into the recipient’s existing content earn a backlink 48% of the time — significantly higher than standard outreach. Additionally, 54% of infographic-led link building strategies see a 10% higher click-through rate to landing pages [Outreach Monks, 2025].
Frequently Asked Questions About Infographic Links
What Are the Top Infographic Sites?
For research and hosting, use: Google Image Search, Piktochart, Snappa, Infogram, Canva, Venngage, and Visme.
Where Are the Best Infographic Directories?
Submit your finished assets to: Visual.ly, SlideShare, Behance, Daily Infographic, Reddit (r/infographics), and Infographic Journal.
Can Infographics Help SEO?
Yes. By earning high-authority backlinks and increasing “dwell time” on your pages, infographic links signal to Google that your content is helpful and authoritative, directly improving your SERP rankings.
Can You Outsource the Entire Campaign?
Absolutely. Many brands outsource research, design, and outreach to specialized agencies like SERPReach to ensure professional-grade assets and high-success outreach campaigns.
For more link building strategies, see our 20-point checklist, pricing guide, and AI for link building guide.
Disclosure
SERPreach provides niche edit and guest posting services. Infographic link building is one of many strategies we recommend.
References
- HubSpot. (2024). State of Marketing Report. hubspot.com
- Spiralytics. (2025). 81 Link Building Statistics. spiralytics.com
- Konker. (2025). Strategic Link Building Case Study: 150% Growth. konker.io
- Ranko Media. (2025). Link Bait Case Study: 100+ White Hat Backlinks. rankomedia.com
- Outreach Monks. (2025). 50+ Link Building Statistics. outreachmonks.com

